Using the software
Overview
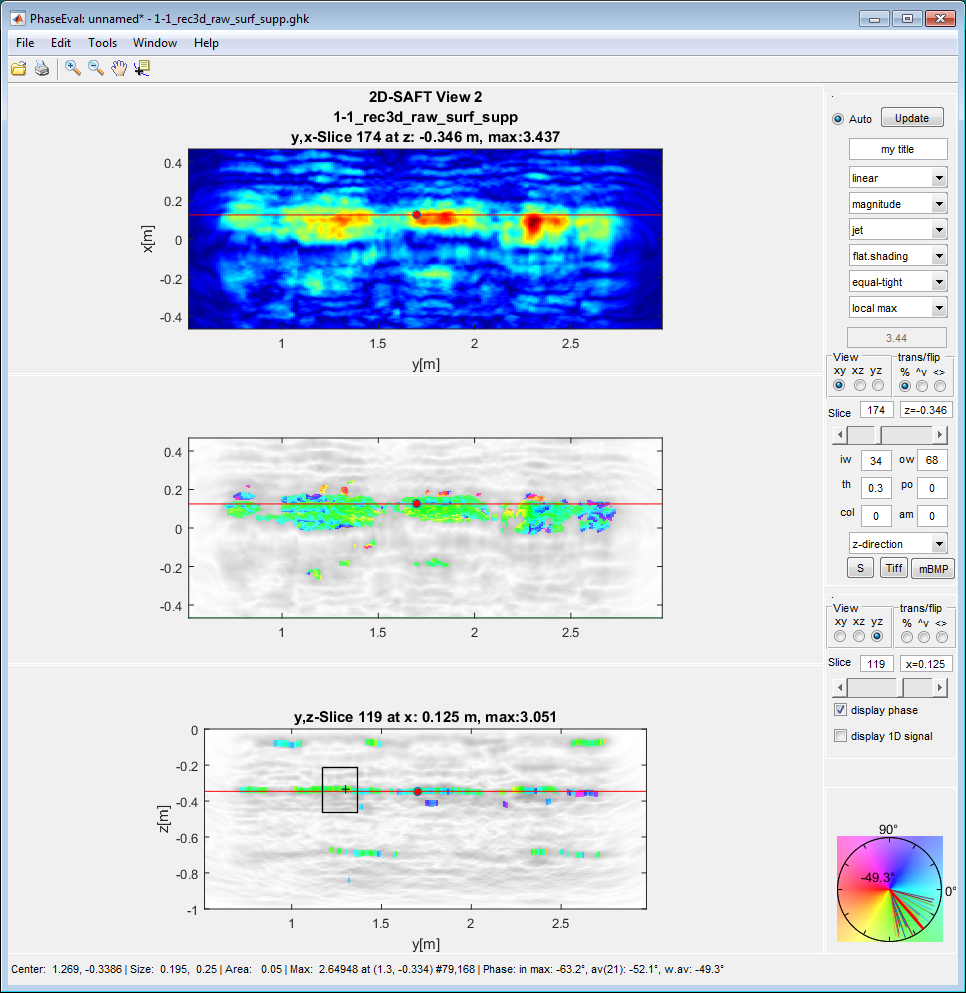
The module PhaseEval is part of the Pundit Vision software package. The originally developed software is replaced by a newer version which allows to use three slice figures at a time. Many additional features are now implemented to support the interactive exploration of the data. The handling shoud be very intuitive, because it uses standard features of modern software. The features are self guiding therefore a detailed description is boring and should be avoided here. On many objects in the figure there are now possibilities to get extra activities with the right mouse. You can switch between the two axes and the three axes mode by “Window -> Extended display”.
Working with Projects
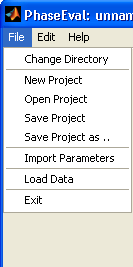
File menu
A project is a simple idea of concentration to one specific task. If you start phase_eval, an unnamed project is created, which can be saved at any time and contains all parameters of calculation and display of the actual state. Data and results are not stored in a project file, because the recalculation mostly only takes seconds. Loading a project at a later time needs the data again and should give after recalculation the same results as before.
How to do a calculation
There are two main processing modes of PhaseEval:
a) PhaseEval is called from InterSAFT or Browser and works as slave to those applications: This means, all data are provided by the calling module.
b) PhaseEval is called stand-alone e.g. from Pundit Vision. Then you have to load the data separately. In stand-alone mode it is useful to work in the extended mode. This means that you can display 3 separate images concurrently.
Be sure that your data are in a ghk file format or in a readable format like “muse”. The ghk file format contains all information to build the coordinate axes and to annotate the figures. The data may be an array of A-Scans (i.e. (t,x,y)) or reconstructions (i.e. (z,x,y) or (x,y,z).
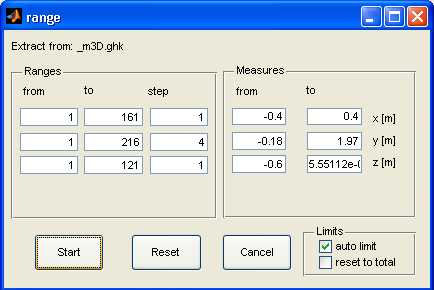
Range popup window to select a sub array of your data
Load the data description by File -> Load Data
Give a downsampling to prevent huge calculations at the beginning. Note, however, that the phase analysis is performed along the time axis or the z-axis. Therefore, these axes should be resolved as high as possible.
Check some parameters:
for A-Scans the center frequency is important: go to “Settings -> Phase Parameters 1 and give the correct center frequency. The center frequency and the wave velocity is usually part of the file header, so that you can use that if it fits to the reality.
for reconstructed images the center frequency and the wave velocity used for reconstruction is important: go to “Settings” and give the correct frequency and the correct wave velocity if necessary
Start the calculation: Press the red start button (top right) and wait for a) reading the data and b) doing the phase calculation.
Now you should see a b-scan of the data (axis at top) and a b-scan of the phase calculation (axis at bottom).
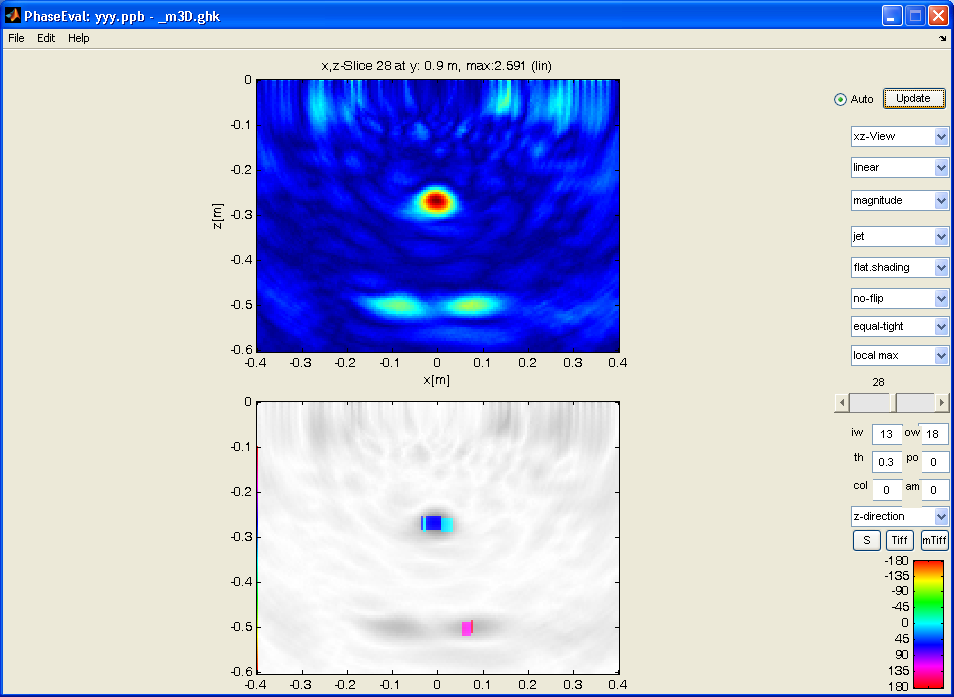
Magnitude B-image and phase B-image after start of processing
You can select which slice you want to see or which view of the volume is displayed. The appearance of the data can be influenced by changing the already known parameters like: linear / log /signed log display, real part, imaginary part, magnitude, shading and some flipping and axis options.
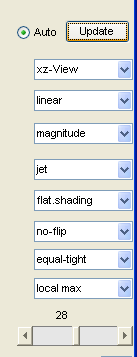
Tools to change your display
You can change the phase calculation parameters. But be careful because changing of parameters may lead to a recalculation of the 3D volume. To avoid this you should deselect the “Auto” radio button, this means recalculation is only done, if you click on “Update” button. Sometimes it may be necessary to press the “Update” button to rebuild the display. This is due to the fact that when various parameters are changed, not all displays are updated automatically for reasons of computing time.
Changing of some parameters like “number of colors” or “Phase offset” don’t need a recalculation.
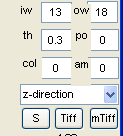

Some phase parameters can be changed in the main figure without using “Settings”
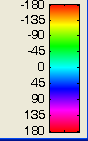
You can switch the phase colorbar to a colorweel which is more intuitive but can not be annotated by a legend.
You can produce a single tiff image of the current display (Pushbutton “Tiff”) or a series of images by the multi-tiff button (“mTiff”). The Tiff files are named according to the data file name and enumerated and the name contains information of the view (v), slice (s), data type, and range.Example of an image file: _m3D.ghk.v2.s016.mg.lin.tif
If you like to make more sophisticated parameter changes, you should open the parameter panel by “Edit->Settings”.