Parameter description
The changes of parameters can be reached from “PhaseEval -> edit -> settings” or from “InterSAFT -> Tools -> Phase Options”.
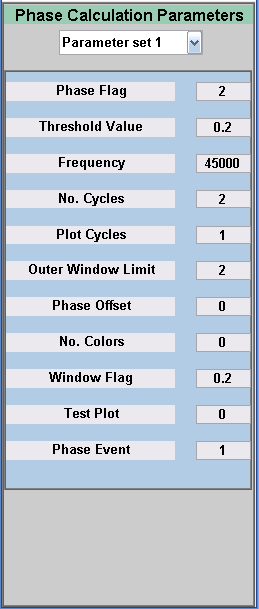
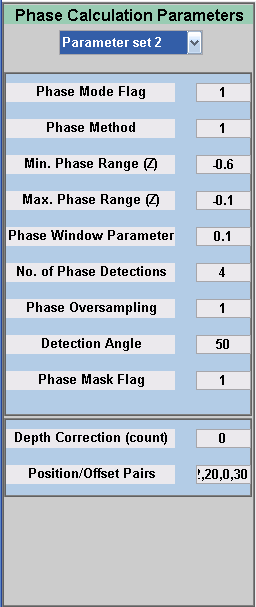
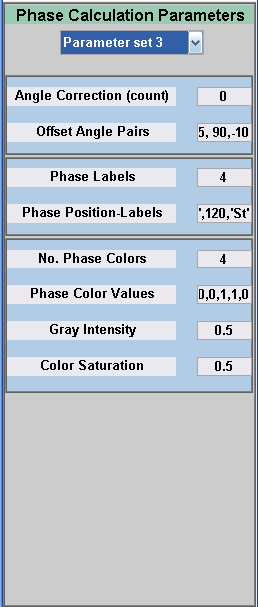
Phase calculation parameters.
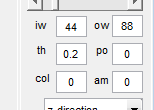
Some of the parameters may be changed in main window. PO: Phase Offset, th: Threshold, col: No. Phase Colors, am: gain exponent. Other parameter are for display only: iw: inner window of evaluation (samples), ow: outer window for separation (samples)
Phase Calculation Parameters
Name |
Value range/Type/Unit |
Meaning |
|---|---|---|
Phase Flag |
no meaning in phase_eval |
|
Threshold Value |
0.1 |
Detection threshold normalized to the global maximum |
Frequency |
[Hz] |
Center frequency of the analysis. |
no. cylcles |
1,2,4 |
Number of cycles (at center frequency) to be used for analysis |
Plot Cycles |
1,2,4 |
Number of cycles to be plotted in the color according the phase |
Outer Window Limit |
1…2 |
Relative enlargement of the distance between two indications |
Phase Offset |
-180/180 |
Additive number for correction of the phase calculation |
No. Colors |
0,1,2.. |
Number of colors used from color table: 0: continuous. No meaning for external color tables |
Window Flag |
0..1 |
Parameter of the Tukey Window applied to the full range before the analysis. (0: no window) |
Test Plot |
0..nx |
Display of intermediate results at the cursor position or at nx |
Phase Event |
1..no. of phase detection |
Testplot of the n-th detection in a line. The values are sorted with maximum first. |
Phase Mode Flag |
1,2 |
1: 1D, 2: 2D Analysys of the data |
Phase Method |
1,2 |
1: Analysis at the biggest spectral line; 2: Analysis at the spektral line with the given frequency |
Min, Max Phase Range(z) |
[m] |
Limits of the depth range (z-direction). The range is marked at the left border of the phase image |
Phase Window Parameter |
Tukey window parameter of the window applied to the analysed data section. (0: no window) |
|
No. of Phase Detections |
1,n |
Number of maxima which are analysed per line |
Phase Oversampling |
1,2 |
Oversampling of the data section to be analysed. Should improve the maximum detection. |
Detection Angle |
Restriction of the angle range used with 2D analysis. |
|
Phase Mask Flag |
0,1 |
Indication of the detected angle for 2D analysis within the phase image (yes/no) (0/1) |
Depth Correction (count) |
0,n |
Number of phase correction points in z-direction used in the next input line. The correction points are interpolated by spline interpol. |
Position/offset Pairs |
[m], [Grad] |
List of n pairs (z-value, phase value) |
Angle Correction (count) |
Number of phase correction points in angle direction used in the next input line. The correction points are interpolated by spline interpol |
|
Offset Anlge Pairs |
[Grad,Grad]-90,-90,-180,180 |
List of n pairs (z-value, phase value) |
Phase Labels |
0..n |
Number of list elements for user defined text at the color table |
Phase Position Labels |
List of n pairs (phase value, label) for user defined text at color table |
|
No. Phase Colors |
0..n |
Number of list elements for user defined colors as RGB values |
Phase Color Values List of n triple (r,g,b) values, in the range (0 .. 1) |
||