Filtering 2 Module
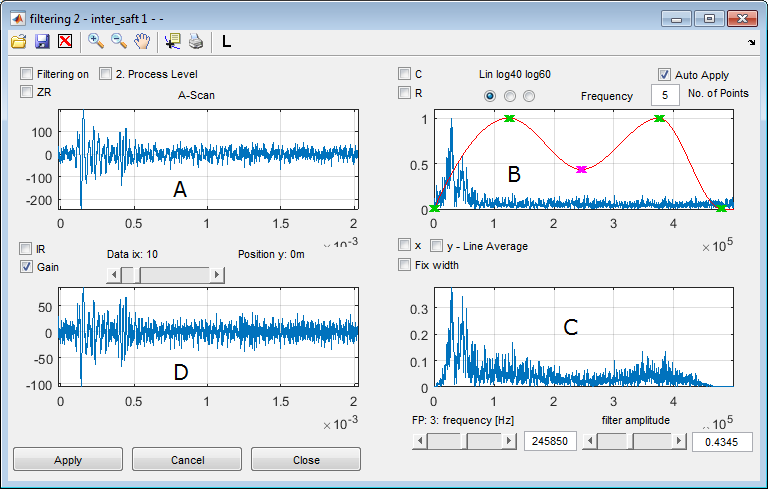
The filtering 2 module is an implementation for Fourier filtering of the A-scan data by a more complex filter function You see 4 different plots, showing:
the selected A-scan, which can be selected by the slider ‘Data ix’ or graphically in the main window,
the Fourier spectrum of “A” with a red curve showing the filter function. The filter function is a combined function of stepwise cosine segments. The mouse can be used to shift the filter transition points.
the spectrum of “A” after filtering
the processed signal in the time domain
Parameter |
Meaning |
Filtering on |
Switch for applying filtering to the data |
2. Process Level |
Select a second filter setting for the second reconstruction step (usually unused!) |
ZR |
Zoom Reset |
IR |
Impulse Response: Apply the filter operation to a synthetic Dirac impulse |
Gain |
Apply and display the time gain control (TGC) to the filtered data. |
C |
Clear all filter parameters |
R |
Reset all filter parameters to a originally used state |
Lin log40.. |
Linear or logarithmic display of spectrum |
No. of Points |
Number of filter transition points which define the number of cosine segments |
Filter parameter |
Frequency and amplitude of the selected transition point. For the selection use the left mouse button. |
freq. range |
definition of the minimum and maximum frequency of the bandpass filter function |
Auto Apply |
If set, changes of parameter are immediately applied to the data and a recalculation of the reconstruction is induced. |
Note
You must select a transition point two times to change the position. This is necessary to avoid unintentional parameter changes.
Note
The DC value suppression is calculated on demand of the preprocessing module. If there is a DC value which is not suppressed, the spectrum may look very small. You may use “zoom” options in the figure.
Note
If you select the A-scan in the main window and the main windows displays a reconstructed image the index is derived from the x-position of the cursor. In case of linear array operation the index is linear from the left start. It is advised to use selection in the filtering figure itself.
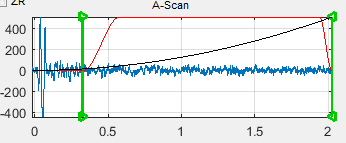
In plot “A” the gain function and the time window from the preprocessing module is displayed and can be manipulated with the mouse.