Deconvolution Module
The deconvolution modules helps to create a spectral function which is applied during reconstruction process to all data together with the spectra of the filtering moduls. To do convolution processing a individual reference signal is necessary. A reference signal from the library can be selected by “File -> load filer from bank”. You can generate a reference signal by yourself with “Tools -> Call extract reference module”
- This module provides the implementation of the following signal processing techniques.
Filtering
Correlation
Convolution
Deconvolution
Phase deconvolution
- Wherein every process can be adapted to use following window functions as filterfunction in frequency domain
tapered Cosine Window
Bartlett Hann Window
Bartlett Window
Blackman Window
Chebyshev Window
Gaussian Window
Hamming Window
Hann Window
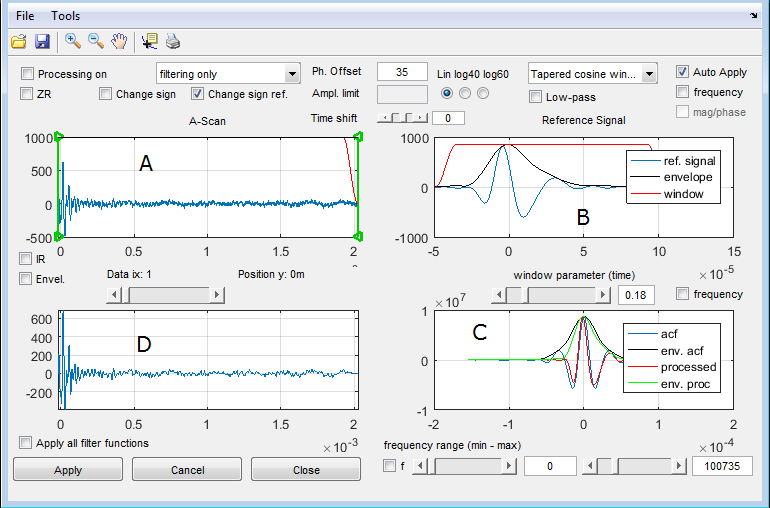
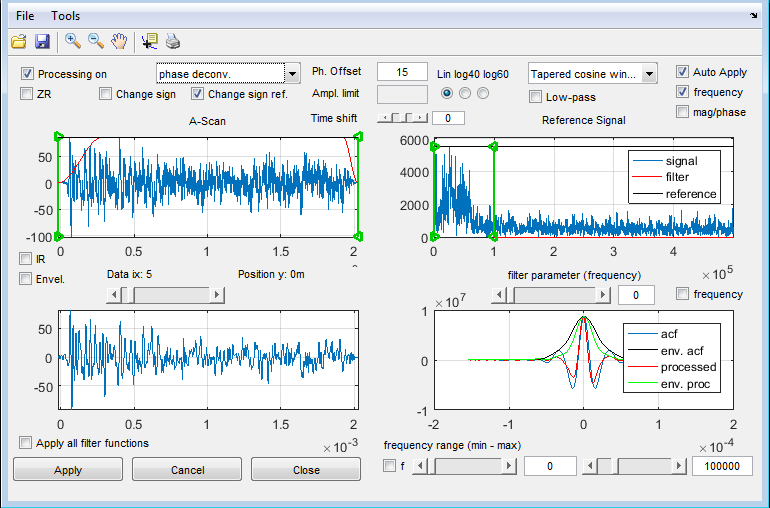
The visualization of output contains 4 subplots. (A) One selected A-scan, (B) Used reference signal + Filter, (C) Processed A-scan, (D) Processing results on reference signal.
Common Parameters
Parameter |
Meaning |
Filtering on |
Switch for applying filtering to the data |
2. Process Level |
Select a second filter setting for the second reconstruction step (usually unused!) |
ZR |
Zoom Reset |
IR |
Impulse Response: Apply the filter operation to a synthetic Dirac impulse |
Envel. |
Display additionally the envelope of the processed signal in “D” |
Change sign |
Change the sign of the processed signal |
Change sign ref. |
Change the sign of the used reference signal. Filtering uses no reference signal |
Ph.Offset |
Phase offset multiplied as complex number \(\exp (j \phi )\) on each frequency value. |
Ampl. limit |
Parameter used only for deconvolution |
Time shift |
Additional time delay multiplied as complex number \(\exp(j \omega t_0)\) on each frequency value |
Lin log40.. |
Linear or logarithmic display of spectrum |
Filter parameter |
Filter parameter for the tukey filter function in frequ. domain 0: rectangle 1: 1-cosine |
Low-pass |
Switch from band-pass to low-pass type of filterfunction |
frequency |
display plot of frequency and filterfunction of data or time domain and window function of reference |
freq. range |
definition of the minimum and maximum frequency of the bandpass filter function |
Auto Apply |
If set, changes of parameter are immediately applied to the data and a recalculation of the reconstruction is induced. |
Filtering
The deconvolution module can be used like the filtering 1 module. There are 2 features which are only available here:
additional phase offset applied to all spectral values
additional time shift applied to all A-scans
Convolution, Correlation
Convolution and correlation techniques require a reference signal, which must be sampled with the same frequency like the data itself. The method is strait forward, additional filtering, phase offset and time delay may be applied.
Deconvolution, phase deconvolution
Deconvolution by a reference signal means that, the signal is divided by the spectrum of a reference signal. Spektral division results in big problems if the reference signal itself is not noise free or contains frequency values with low amplitude. We use a Wiener Filtering approach, where an extra parameter in the denomintor can manually applied as Ampl.limit which is a value normalised to the maximum of the spectrum. The resulting filter function is plotted in B, so that you may observe the effect. Usually an additional filter function has to be applied to get a useful impulse response. The effect of the processing can be observed in plot “C”. This plot can be magnified by the pressing the right mouse in plot “C” and selecting “Plot in extra figure”.
To avoid the problems with deconvolution and the division by small noisy frequency you may selelect the option “phase deconvolution”. This means that the original spectral energie of the signal is preserved and only the phase of the signal is compensated. This technique works very well if the reference signal does not contain multiples of an impulse.
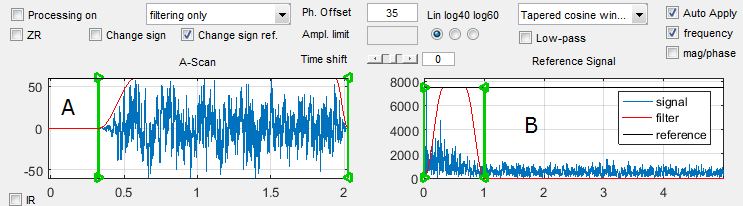
Example: Parameters for filtering
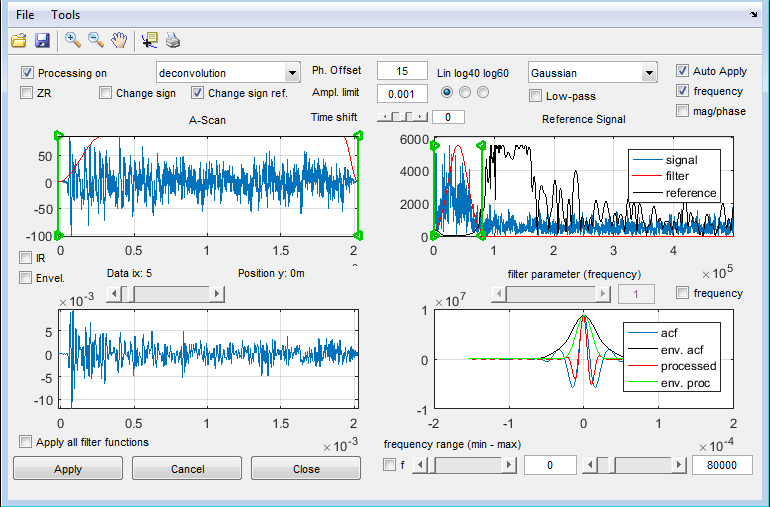
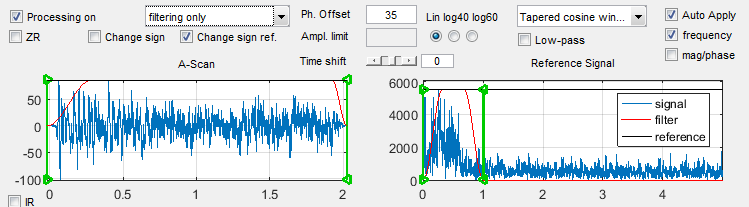
Example: Parameters for deconvolution
Example: Parameters for deconvolution
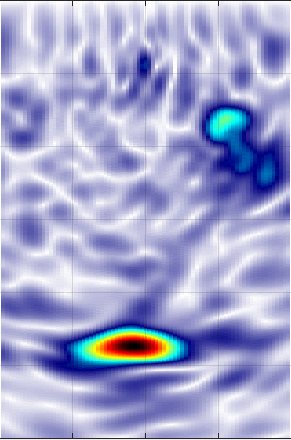
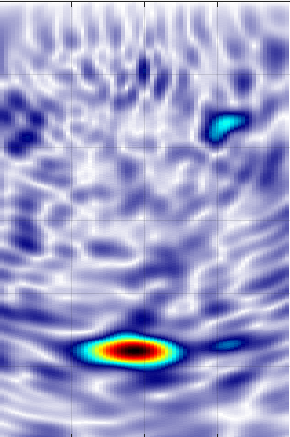
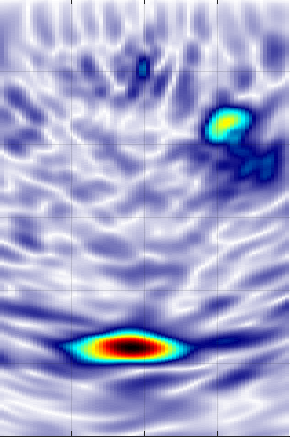
Example of a SAFT envelope image of an ultrasonic reflection from a tendon duct and a backwall. Left: filtering, middle: deconvolution, right, phase deconvolution
Note
The phase offset is important
if you want to compare phase values in the reconstruction
if you want to do a very precise depth estimation by evaluating the real part of the reconstruction.
Remember: The reference signal is gained from a signal in a specific depth (e.g. backwall at 300mm). In the case of superpositions of small single transducer signals the phase of the complete signal is depth dependend.