Panels in main figure
Main figure
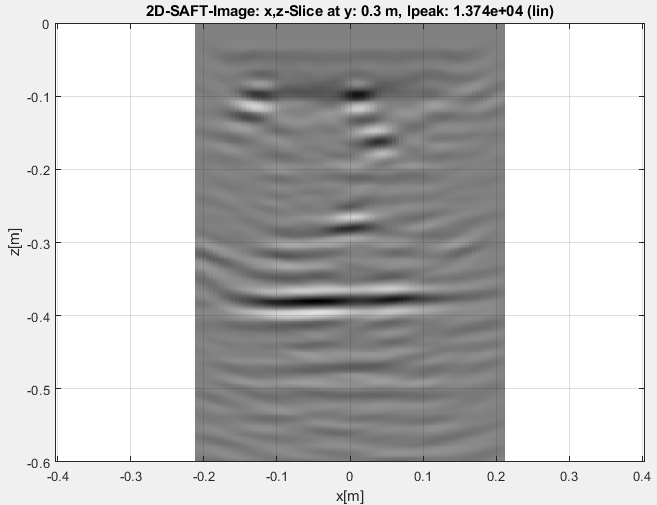
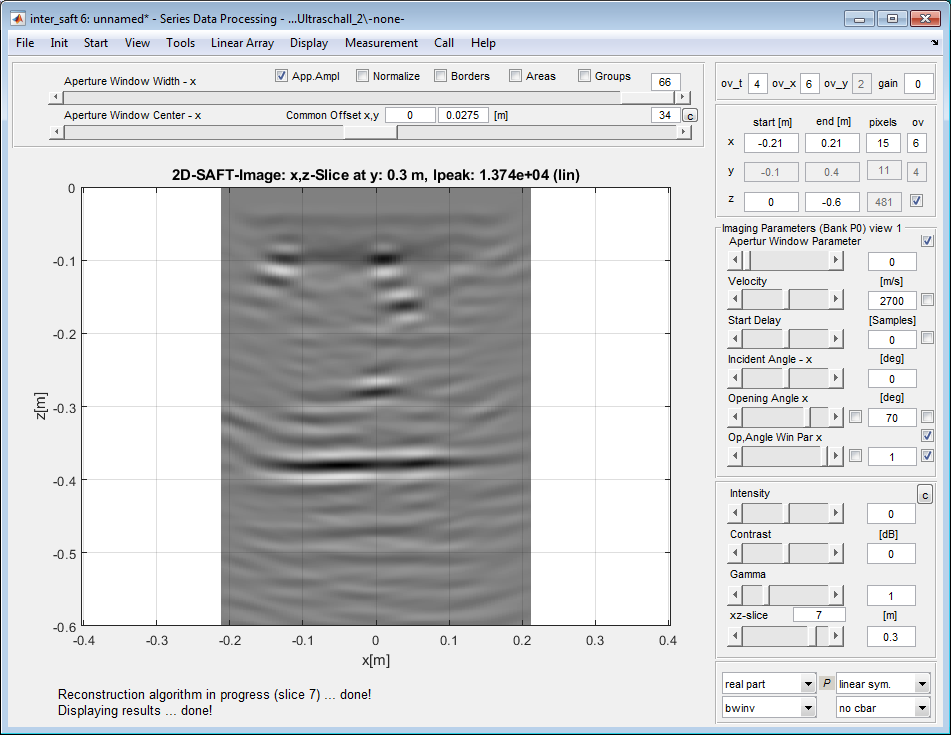
This figure is opened if you call InterSAFT. It contains different sections which we call panels. The panels are grouped around the main axis which displayes the calculation results or the preprocessed A-scans.
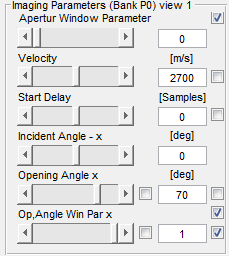
Aperture selection
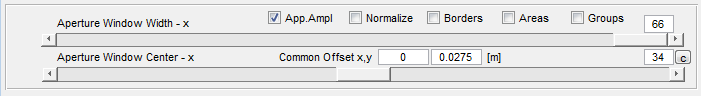
Above the main axis you can find a panel for selecting a range of A-scans from one slice of the data. You can observe how the selection of the data influences the imaging result interactively and how the other imaging parameters influences the processing of one or more A-scans. The panel was originally designed for impulse echo data and it is less important for linear array data because the linear array data are not arranged in a way that the number of an A-scan corresponds immediately with the x-coordinate. (See: Aperture Window)
Parameter |
Meaning |
|---|---|
Aperture Window Width |
Number of A-scans to use for calculation |
Aperture Window Center |
Center of the number of A-Scans which are selected |
Common Offset x,y |
Offset into the x or y direction of the tranmitter to receiver transducer |
App. Ampl |
Apply amplititude correction for A-scan comming from internal or external editing. |
Normalize |
Switch normalizing option during SAFT processing. |
|
Switch objects of geometry editor for display. |
Button (C) |
Reset Aperture Width and Center to full Aperture |
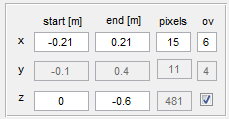
Area selection
Imaging parameters
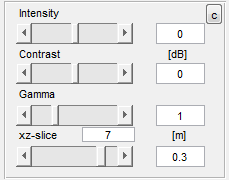
Display parameters
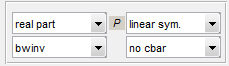
Display selection
Main axis