Geometry Design of Wooden Blocks for Ultrasonic Imaging
This report introduces a tool for CAD design of wooden blocks used in most general constructions. The purpose of this tool is not only generating geometry it provides a platform for the ultrasonic image reconstruction using time reversal technique. The basic principle lies in transferring the measured B-scan data onto the interfaces between any two wooden blocks using the time reversal technique. And thereby we can have the elastic wave fields on the interfaces (B-Scans) which are back propagated using time domain SAFT reconstruction method, into the wooden blocks in order to locate the defect. The software InterSAFT (see quarterly report 2) utilizes the geometry defined by this tool to execute defect reconstruction.
The geometry is defined in 3D Cartesian coordinate system with x, y, and z-axes. User can generate the geometry in the following steps.
Step 1: User has the facility to select the geometry type as shown in Fig. 1. The parameters provided in the table “Default reconstruction parameters” are used for reconstruction when user selects “Homogeneous” flag. These three parameters are described in the section 2.1. When “Inhomogeneous” is selected than the parameter values provided for each wooden block geometry in table “Block information yz-plane” (about this table see Step 5) will be taken for the reconstruction.
Step 2: Provide the full volume data information and number of xy-plane layers in the table “Volume information”. After data entry user can visualize the complete volume using the button “Display Full Volume”. An example of such visualization is displayed in Fig. 1.
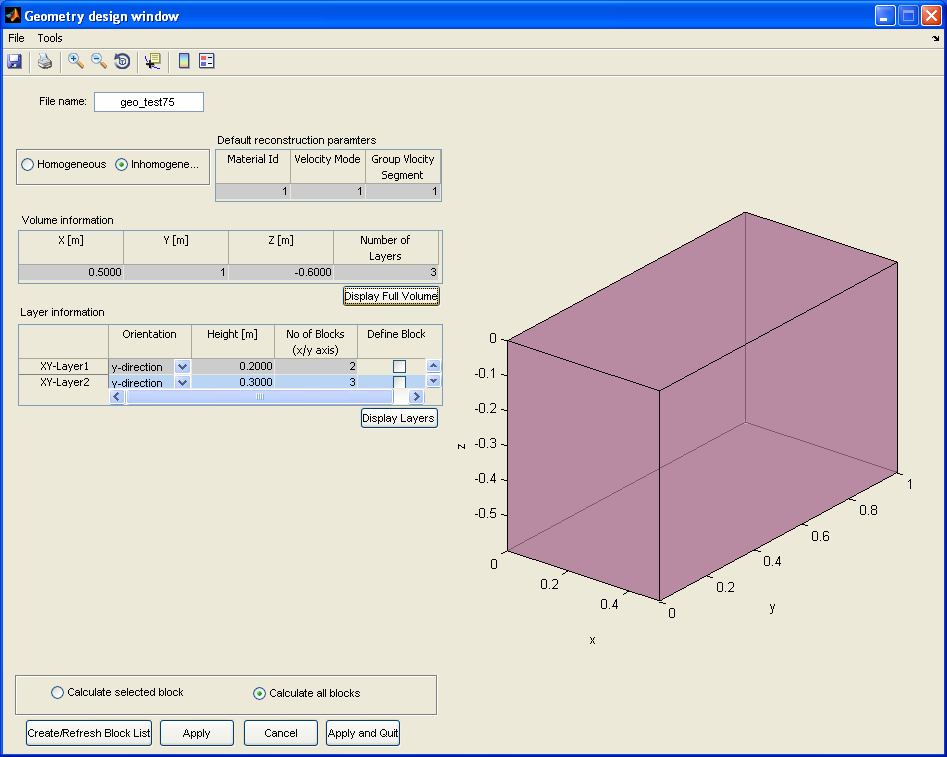
Display of full volume.
Step 3: The “Layer information” table is adjusted based on the user provided data in step 2. In this table (Layer information) user has to provide the information of the layers such as height of each xy-plane layer and number of the blocks along the x-axis. User can display the layers using the button “Display Layers”. An example is illustrated in Fig. 2. The fourth column with check boxes is used to define the information of blocks in xz-plane and eventually opens the “Block information xz-plane” table of the respective layer.
Note
Please enter the valid information. Good results are obtained when the summation of all the layers height is equal to the parameter value “Z [m]” provided in the “Volume information” table.
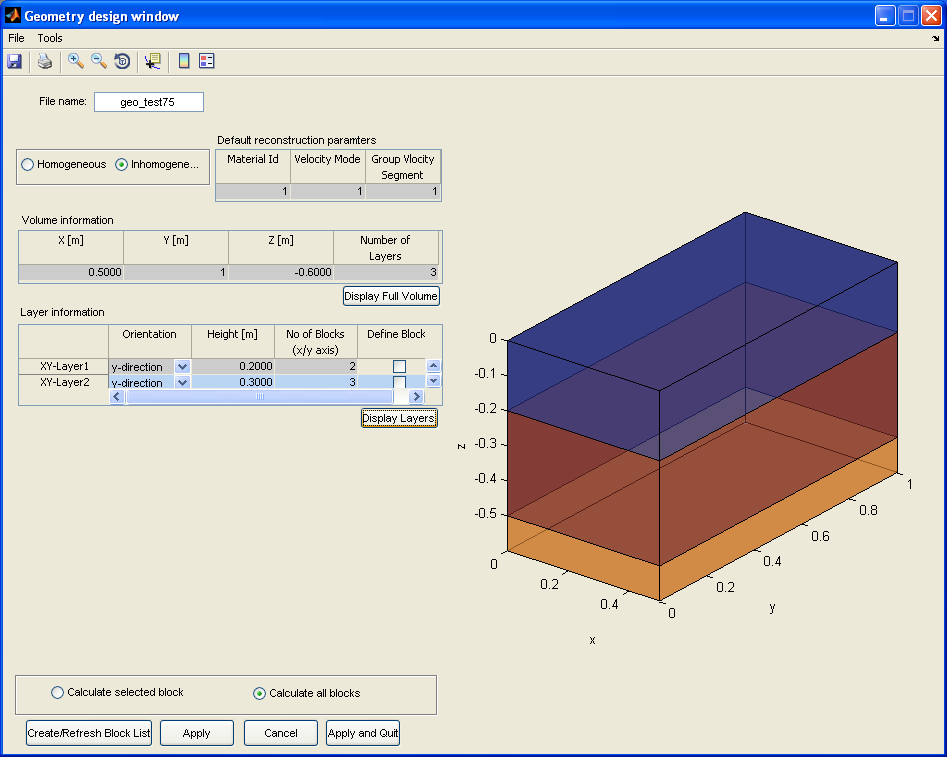
Display of full layers.
Step 4: The “Block information xz-plane” table is adjusted based on the number of blocks provided in the respective layer of the “Layer information” table. User has to provide information such as width of the each block in xz-plane and number of blocks along the y-axis. It is assumed the width of the blocks along the y-axis is same as width provided in this table. The length of blocks along y-axis is defined in the table “Block information yz-plane”. This table (Block information yz-plane) is invoked whenever the check box in the in the third column of “Block information xz-plane” table is checked. An example is shown in Fig. 3.
Note
Please pay attention while entering the data. Good results are yielded when the total of all the blocks width is equal to the value “X [m]” provided in the “Volume information” table.
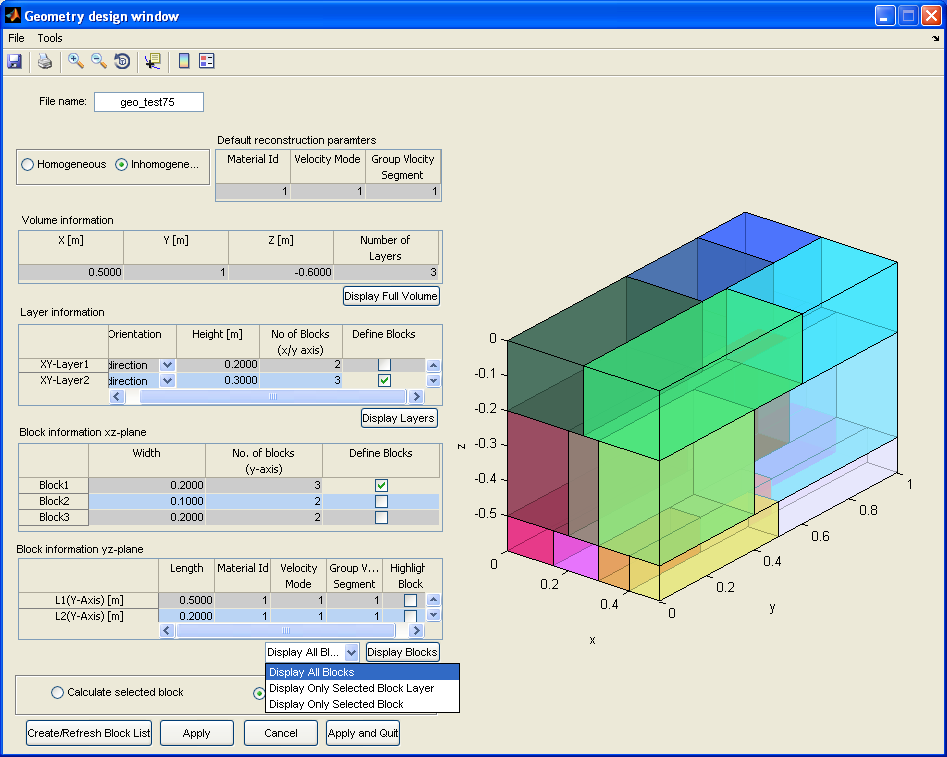
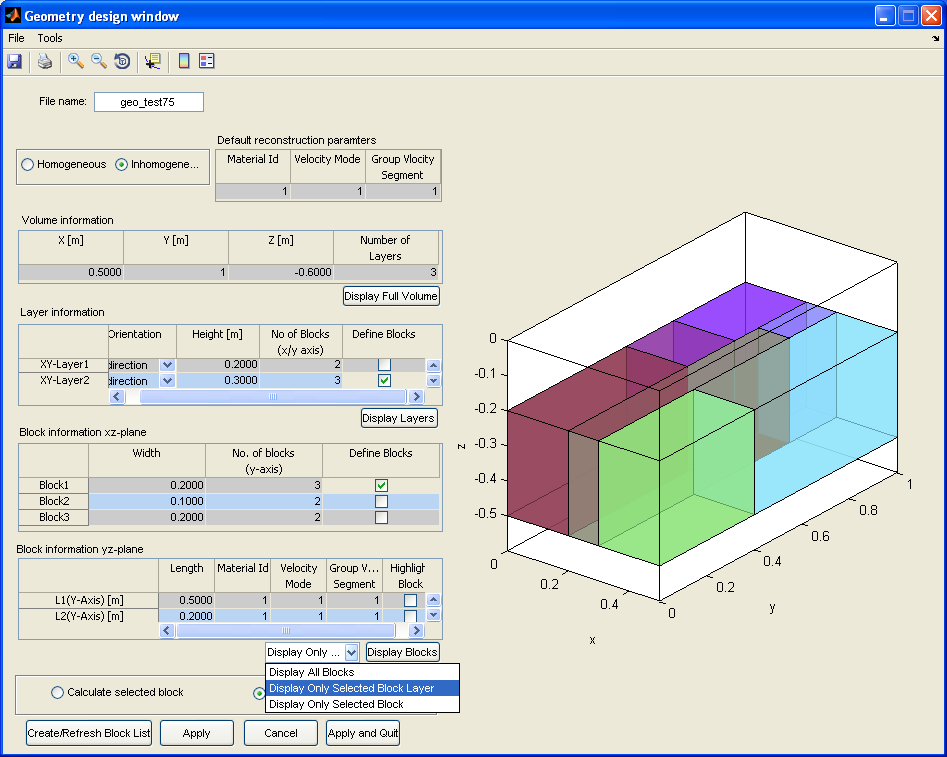
Step 5: The “Block information yz-plane” table is adjusted based on the number of blocks provided in the respective blocks data of “Block information xz-plane” table. User need to submit the information like length of the each block along y-axis and the material id, velocity/mode, group velocity segment. When the “Homogeneous” flag is set the later three parameters are equal to the respective values provided in the “Default reconstruction parameters” table. Filling this table for all the blocks of “Block information xz-plane” table brings up the complete geometry. Under this table (Block information yz-plane) different methods of visualization modes are presented in the popup menu. After selection of particular choice user need to press “Display Blocks” button to refresh the visualization. The functionality of all the popup menu items is depicted in Fig. 4, Fig. 5, and Fig 6.
Note
Please pay attention while entering the data in the table “Block information yz-plane”. Good results are yielded when the total of all the blocks length is equal to length parameter value “Y [m]” provided in the “Volume information” table.
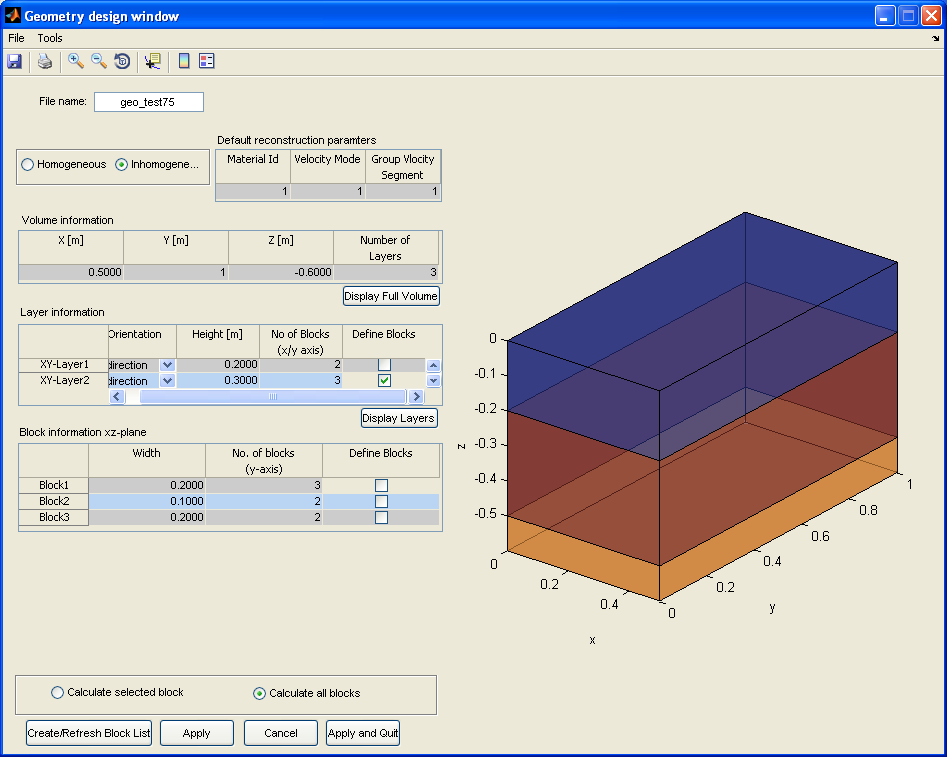
Illustration of data in “Block information xz-plane” table.
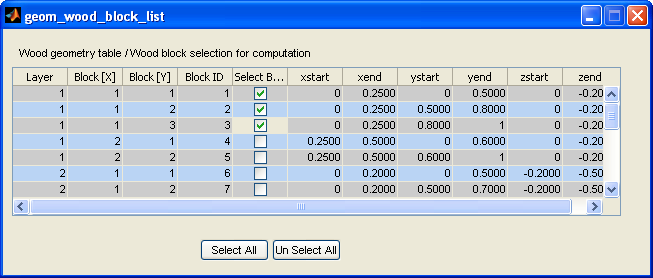
“Create/Refresh Block List” button open the window with the summery of the geometry information as shown in the Fig. 7. The selection of check boxes in this window highlights the blocks in the visualization as shown in Fig. 8. The reconstruction can be limited to only the selected blocks. To reconstruct the full geometry please press “Select All” button in Fig. 7.
Display of the blocks.
Display of only top layer blocks.
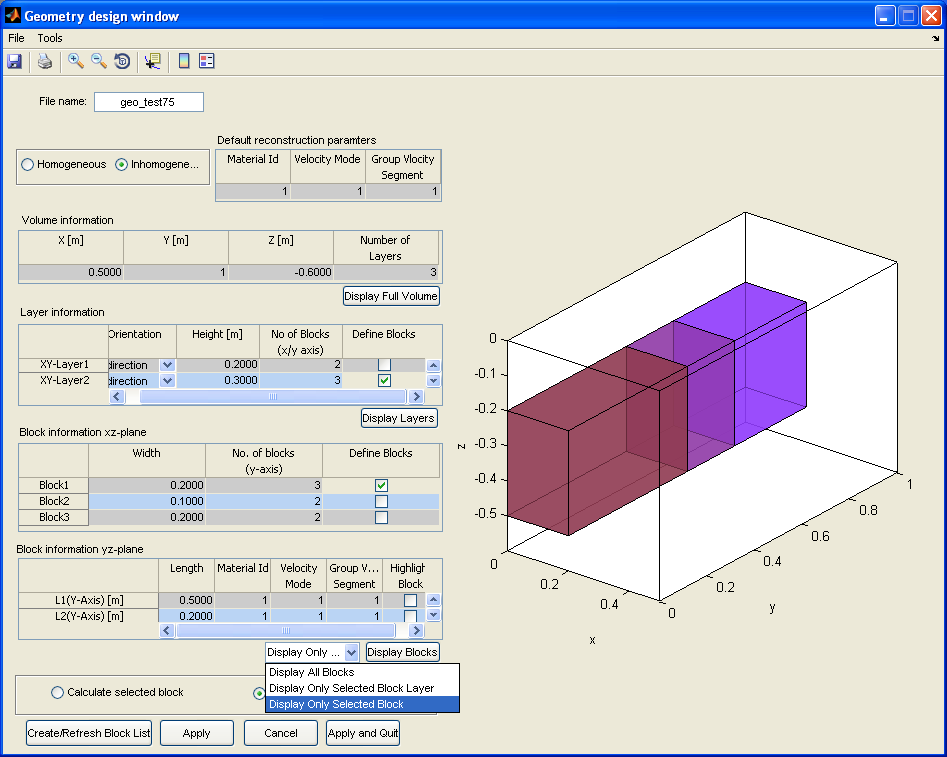
Display of only one row of blocks. A specific selected block from table “Block information yz-plane” is highlighted.
Selected (checked) blocks are highlighted in the display.
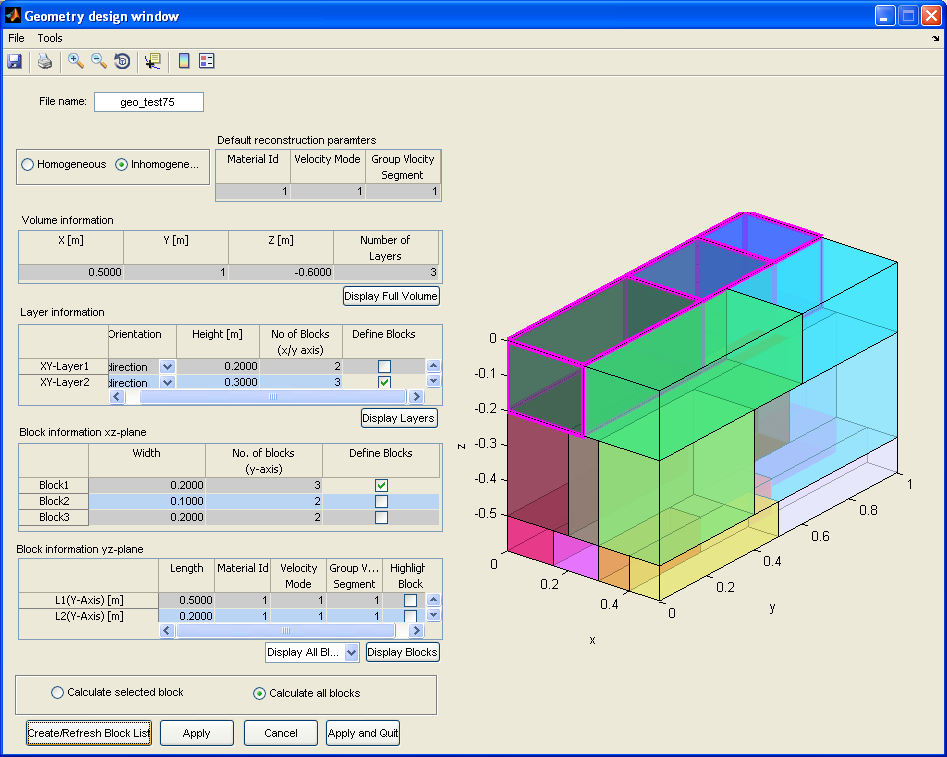
The selected (checked) blocks in Fig. 7 are highlighted in the display.
After furnishing the entire correct data user must confirm the information by pressing the buttons “Apply” or “Apply and Quit”. The cancel button cancels any modification of the parameters in the geometry tables before pressing of the “Apply” or “Apply and Quit”.
TOOL ACCESSORIES
The “File” menu consists of option to save the geometry file using “Save Geometry File”. The “*.geo” file is saved to disk based on the name provided by the user. These saved files can be loaded any time in future again, using the file menu item “Load Geometry File”. The geometry can also be exported to different formats (bmp, tiff, and eps) and save to disc.
A tool bar with zoom, rotate, data cursor, colorbar etc., functionalities are implemented for interactive play on the displayed geometry.